

What does Cross-Sectional Data Analysis mean?
Cross-sectional data is a process where a venture capitalist, data modeler or fund manager collates and collects data based on observations at the same point in time. Surveys conducted by companies and officials are one of the familiar sources of cross-sectional data. Some other common instances include government records and company financial records. These data set mainly consist of a history of observation of multiple variables at a particular point in time.
Examples of Cross-sectional data sets:
Cross-sectional data sets are not only used for analyzing data for companies or government surveys, but they can also be used in regular life as well.
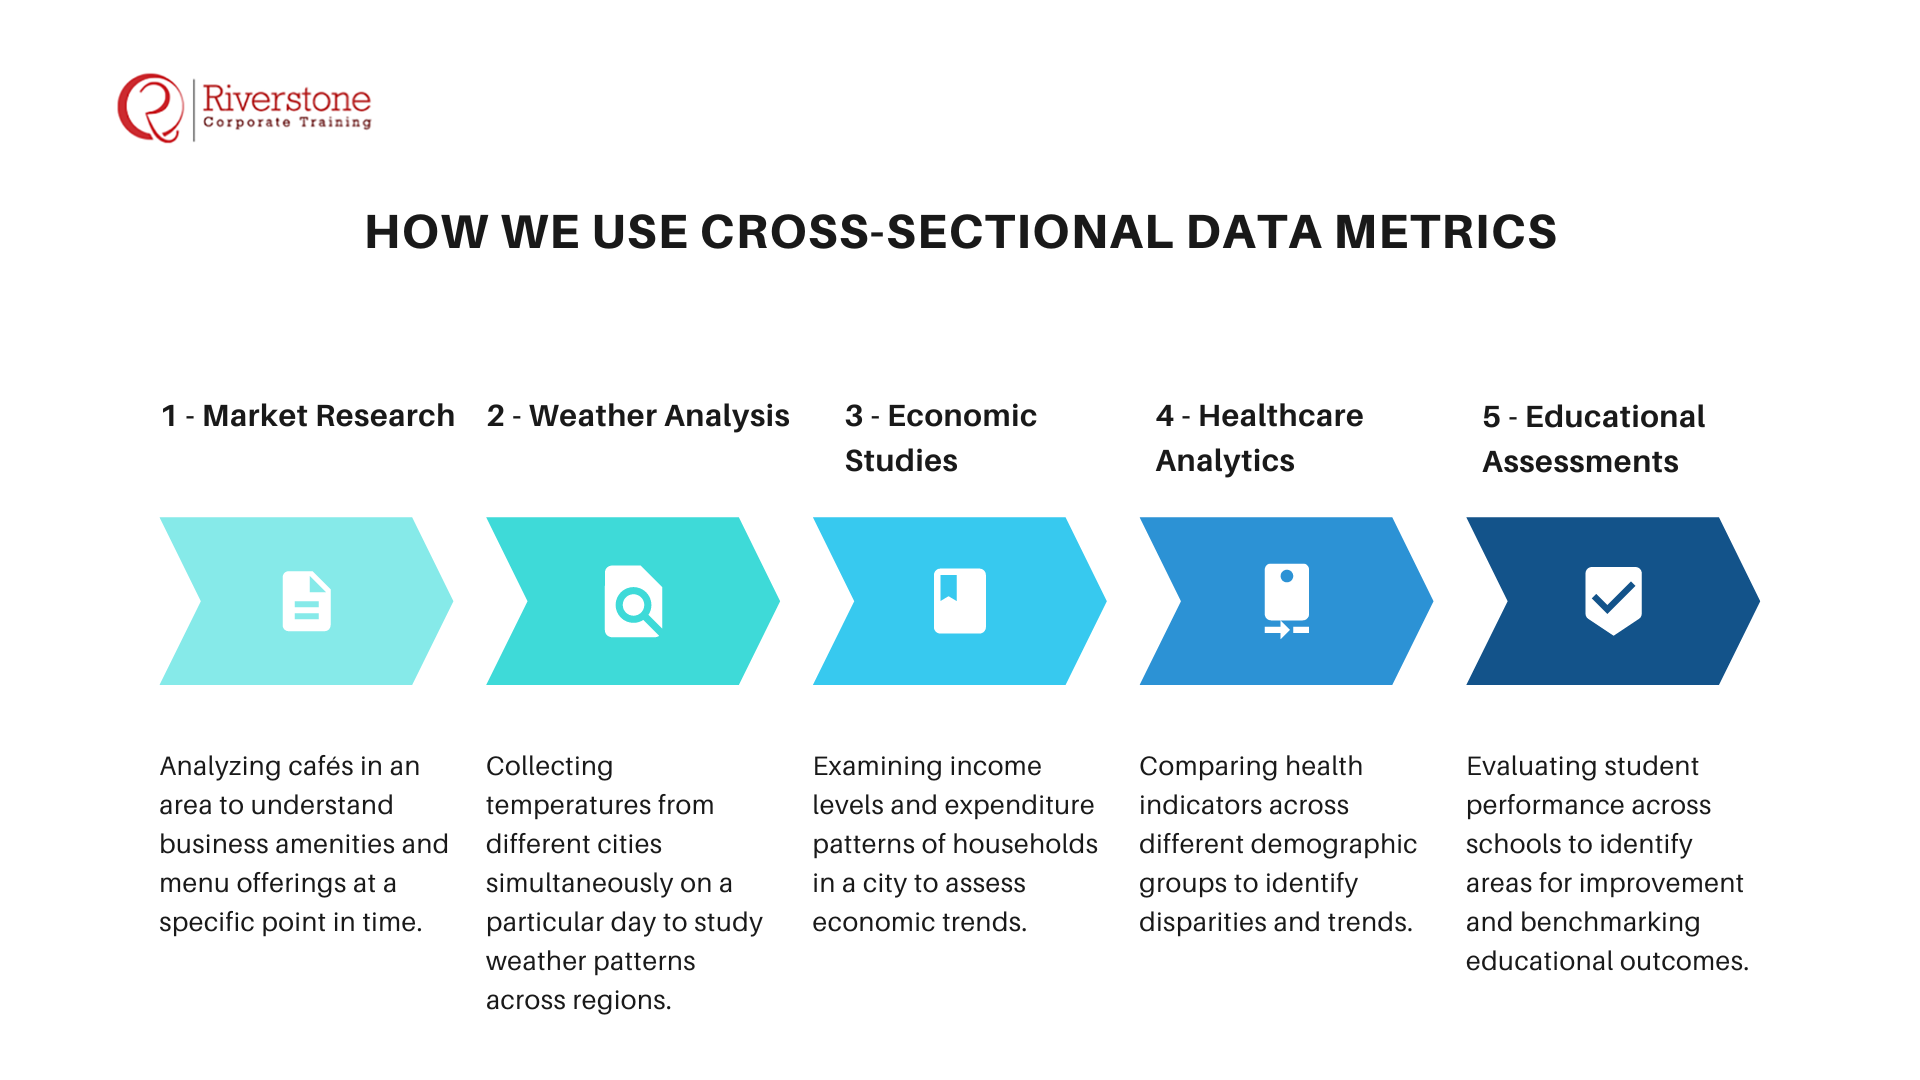
For instance, if one needs data on how much cafés in a particular area offer business and co-working space with an excellent menu consisting of items that help in power up for working employees, they can scan an area for all the necessary data and compile them into a sample. And then, they can cross-check and jot down the category of the required matter. This sample data provides us with a fair idea of eating joints or cafés at that one point in time.
In a somewhat more straightforward way for understanding, cross-sectional data is also the collection and curation of temperatures of different cities at the same time on the same day.
How we Use Cross-Sectional Data metrics?
 Cross-sectional data sets are used extensively in economizing, statistics, and other sociology.
 Cross-sectional data sets are used extensively in economizing, statistics, and other sociology.
In microeconomics, these datasets used to study the labor markets, public finance, industrial organization theory and health economics. Likewise, in political sciences, the data is used to analyze demography and the occasional electoral campaigns.
As the name suggests, Financial Analysts typically compare the financial statements of two companies in which the cross-sectional analysis will help in analyzing the reports of two companies at the same point in time. In contrast with that, the time series data analysis only helps in comparing the financial statements of the equal company across an elongated period.
Furthermore, the financial analyst uses a benchmarking study to identify the estimate, funded debt, the future value, and/or functioning proficiency of both. This gives an understanding to the analyst of that particular company’s returns in the points and allows them to make the most successful investment decision amidst a panel of adversaries under the sector as an aggregate
The pivotal variation between cross-sectional analysis and time series analysis is that the “cross-sectional analysis” reflects the data of several variables at a particular point of time whereas time series data, alternatively known as trend data analysis, focuses on the same endpoint over a duration of time.
Also, there is only a single variable in generating the time series data, whereas there are multiple variables for cross-sectional data.
For instance, in the case of a company, the cross-sectional analysis will help an investor to know which company is the best business metric, whereas time series analysis will help the investor to see the amount of ‘Earning Per Share’ (EPS) over some time.