Project Evaluation Review Technique (PERT)
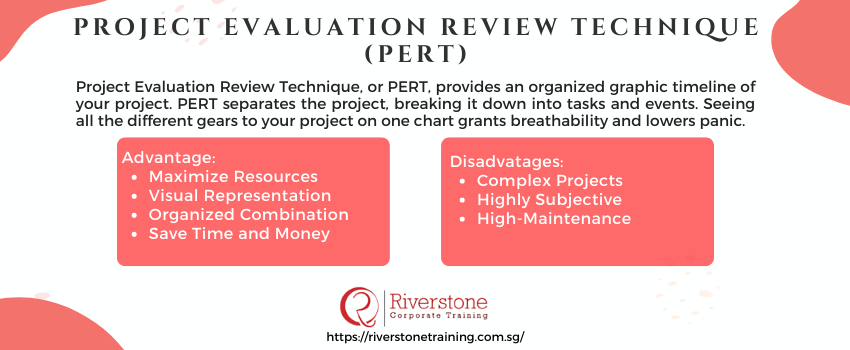
A Project Evaluation Review Technique, or PERT, provides an organized graphic timeline of your project. PERT separates the project, breaking it down into tasks and events. Seeing all the different gears to your project on one chart grants breathability and lowers panic.
Overview of Project Evaluation Review Technique (PERT)
Originating in 1957, PERT was established as an organization tool for operations involving U.S. Navy’s Special Projects. PERT shows a visual chart to scale your project timeline. Either rectangles or circles, called nodes, representing either events or milestones. Those nodes are connected by lines, which consists of required tasks within each step.
Constructing a PERT chart generally follows this order:
- Consider and select milestone and events
- Discover and represent tasks in proper placement
- Diagram drawing
- Time estimation for project. This will include optimistic timing, most-likely timing, and pessimistic timing.
- Estimation of critical path
The visual representation of PERT is easy to follow. The arrows point in the direction of the flow, the lines representing tasks to be completed between each event or milestone. Any dotted lines are part of another project, often called dummy connections.
Benefits of Using PERT:
Maximize Resources: A PERT chart offers
Project Evaluation Review Technique
Managers a visual representation of tasks, and proper order of tasks, required for a project. This allows simple intake to evaluate, gauge, and predict how much time and resources are required for your project. The ability to track required assets is available through any stage of your project.
Visual Representation: Seeing a PERT chart comprised of your project steps the perfect solution to “what-if” scenarios in Project Evaluation Review Technique production. By having all vital Project Evaluation Review Technique information in one place, in front of your eyes, may seem intimidating at first, but once PERT is utilized, you’ll begin to see the different business pathways. Pathways you and your team may have missed previously.
Organized Combination: PERT charts compile necessary information from multiple, all, departments which have a direct impact on the outcome of your project. So, IT goals and steps will be visualized, right with the writing department and any other department necessary.
Save Time and Money: Unlike the popular Gantt chart, PERT charts are put together and utilized before a project starts. Ghantt charts are used whilst the project Evaluation Review Technique is in motion. PERT charts are designed to lay out the timetable, allowing you to make an estimated time for completion of each step, and expectations can be assessed before the project lift-off.
Disadvantages of Using PERT
Complex Projects: It is a real possibility, if your project is more complex, it may be confusing to view and interpret using a PERT chart. Using a PERT chart in conjunction with a Gannt chart for management of complex Project Evaluation Review Technique, may prove useful.
Highly Subjective: PERT charts are put together highly subjectively. If management is inexperienced with them, they may get frustrated with the outcome, and times, deadlines, and cost may be completely thrown off.
High-Maintenance: These diagrams require frequent updating, and while you’re busy running projects, maintaining the chart can seem tedious. Successful project estimates are contingent on keeping the PERT chart updated manually. Continuous reexamination of a project is required to gain insight and keep projects organized.
In Conclusion
PERT charts are a helpful tool for Project Managers to use to predict the timetable of a project. The easily readable diagram shows milestones and events, displays direction of the flow of specific departmental tasks, and when continuously maintained, cost estimations. The many positives and negatives either draw in or turn away Project Managers, but experiences Project Managers may find PERT charts essential to their management.


